


“A sensor is only as valuable as our understanding of its limitations. Misapplied sensors don’t just miss faults — they create blind confidence that puts both machines and people at risk.”
We’ve seen quite a number of them — the reliance, confidence and shock — that shock in the face with the thought “We thought we had it covered“. Unfortunately, they didn’t.
WHY THIS MATTERS
In reliability and safety work, a missed fault is bad—but a missed fault you’re certain you would have caught is far worse. Misapplied sensors generate clean-looking data that can be fundamentally wrong for the physics of the problem. That “blind confidence” delays intervention, inflates MTBF statistics, and can escalate minor degradations into catastrophic failures.
This article distils practical guidance for selecting, installing, and governing sensors so their outputs actually reflect the phenomena you care about.
WHAT CAPABILITY REALLY MEANS
Thinking about capability narrowly (e.g., “what’s the range?”) is how mistakes creep in. A sensor’s capability is the intersection of physics, signal chain, and context:
Measurand and Physics Fit
- Does this transducer couple to the phenomenon (strain vs. displacement vs. acoustic emission)?
- Is the sensitivity sufficient relative to expected signal amplitudes?
- Is the dynamic range / noise floor compatible with early-fault signals?
Frequency and Dynamics
- Bandwidth / usable frequency range (both low- and high-end).
- Sampling rate and anti-aliasing: Nyquist violations create convincing lies.
- Sensor resonance and mounting stiffness can reshape the spectrum.
Accuracy, Precision and Stability
- Calibration uncertainty, thermal drift, aging, and hysteresis.
- Cross-sensitivity (e.g., temperature on strain gauges, EMI on hall sensors).
Environment and Installation
- Temperature, humidity, chemicals, wash-downs, ingress protection.
- Cable routing, shielding, grounding, connector quality.
- Placement relative to the energy path (load zones, flow profile, line-of-sight).
Signal Processing and Decision Logic
- Filters, smoothing, and RMS windows can mask precursors.
- Thresholds, voting logic, and alarming deadbands determine detectability.
COMMON MISAPPLICATIONS (AND WHAT THEY HIDE)
Vibration accelerometers on low-speed bearings
- Pitfall: Standard industrial ACCs (100 mV/g) with high noise floors miss ultra-low energy impacts.
- Hidden risk: Spalls and lubrication starvation progress unnoticed.
- Fix: High-sensitivity ACCs, longer time windows, demodulation/envelope analysis, placement at load zone.
IR temperature guns for process health
- Pitfall: Emissivity assumptions and reflected radiation skew readings.
- Hidden risk: “Normal” temperatures even while internal hotspots grow.
- Fix: Use RTDs/thermocouples where contact is feasible; otherwise set emissivity correctly, use emissivity tape, and control background reflections.
Differential pressure (DP) for flow outside Reynolds regime
- Pitfall: Low, unsteady flow invalidates square-law assumptions.
- Hidden risk: Underestimation of flow → incorrect pump protection logic.
- Fix: Choose a technology suited to regime (e.g., mag meters for conductive fluids), re‑size or relocate taps.
Ultrasonic leak detection in high-wind/steam environments
- Pitfall: Airborne noise saturates the band.
- Hidden risk: Real leaks drowned out by background.
- Fix: Shielding, contact UT where possible, time-gating, or verify during quiet cycles.
Proximity sensors with variable targets
- Pitfall: Different alloys/coatings shift switching distance.
- Hidden risk: Intermittent false OK/NOT OK states.
- Fix: Factor in target material, use teach-in or use optical/mechanical alternatives.
THE MECHANISMS THAT CREATE “BLIND CONFIDENCE”
Aliasing that looks like signal
Under-sampling converts high-frequency content into plausible low-frequency patterns.
Saturation and clipping
Peaks flatten; RMS looks fine; faults vanish into “normal.”
Over-filtering / long smoothing windows
Tightens trends and suppresses transients and precursors.
Mis-calibration & reference drift
Everything moves together; nothing looks wrong.
Structural path issues
Poor mounting or wrong location mechanically isolates the sensor from the fault energy.
A PRACTICAL WORKFLOW TO DE-RISK SENSOR DECISIONS
1) Start from the failure mode, not the catalog
- Define the fault physics you need to detect (e.g., Hertzian impacts at 1–5 kHz; boundary lubrication shift; cavitation broadband noise).
- Quantify minimum detectable signal and time-to-detection requirements.
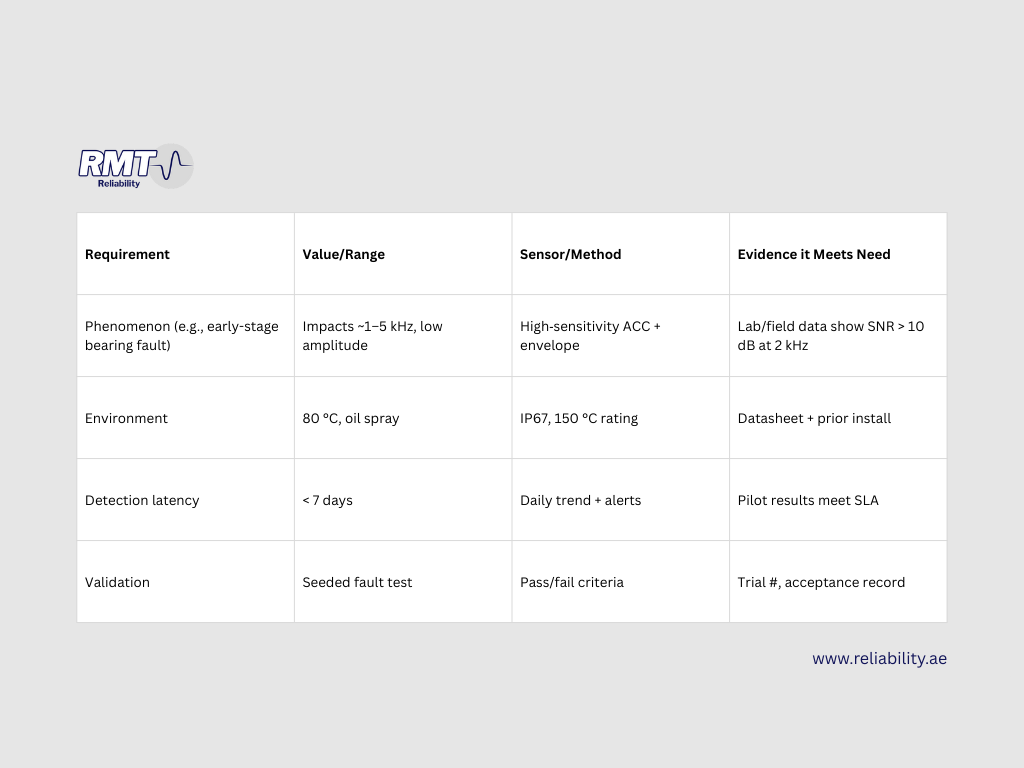
2) Build a Capability–Requirements Matrix
3) Commission with a ground‑truth plan
- Co‑measure with a known‑good reference (portable instrument, handheld thermal, calibrated flow rig).
- Record as-found baselines, mounting photos, torque specs, and exact location.
4) Engineer the signal chain
- Set sample rate ≥ 5–10× the highest frequency of interest; verify anti‑aliasing filters.
- Verify dynamic range: fault peaks should sit well above the noise floor without clipping.
- Tune processing (window length, envelope/cepstrum, detrending) to preserve the phenomena.
5) Prove it in a pilot
- Run side‑by‑side sensors or periodic manual checks.
- Track true positives / false negatives and adjust thresholds.
- Fail fast on marginal tech; swap early.
6) Operate with governance
- Calibration intervals based on duty cycle and environment.
- Firmware/config version control; changes require a short re‑validation.
- Plausibility checks across modalities (e.g., vibration rise should correlate with temperature or current changes).
QUICK DIAGNOSTICS: WHEN THE DATA LOOKS “TOO GOOD”
If you see glass‑smooth trends or flat-line healthy signals for weeks:
- Check sensor health (power, cabling, saturation, mounting).
- Inspect sampling rate and filter settings.
- Compare against redundant indicators (amp draw, process variables, operator notes).
- Perform a stimulus test (tap test for ACC, known temperature step for RTD).
- Revisit placement (is it in the energy path?).
COMMISSIONING AND PERIODIC VALIDATION CHECKLIST
- Datasheet review against Capability–Requirements Matrix
- Mounting verified (torque, surface prep, orientation, photo logged)
- Sampling rate & anti‑aliasing confirmed
- Noise floor measured in situ
- Calibration certificate attached to tag/asset record
- Baseline data captured and labelled
- Plausibility rules implemented (cross-sensor sanity checks)
- Alert thresholds tested with a safe stimulus
- Change log initiated (firmware, config, location)
- Review after first 30 days: false alarms, misses, drifts
METRICS THAT KEEP YOU HONEST
- Detection Coverage: % of top failure modes with at least one proven sensing path.
- Time to Detect (TTD): Median days from onset to first alert, by failure mode.
- False Negative Rate: Confirmed failures with no prior alert.
- Uncertainty Budget: Aggregate measurement uncertainty per critical KPI.
- Validation Debt: Sensors in service without a current validation record.
Ready to elevate your Condition Monitoring Program to the next level?
Contact the experts at RMT Reliability
www.reliability.ae


No responses yet